Can magnetized turbulence supply the heat that keeps cold filaments glowing in galaxy clusters?
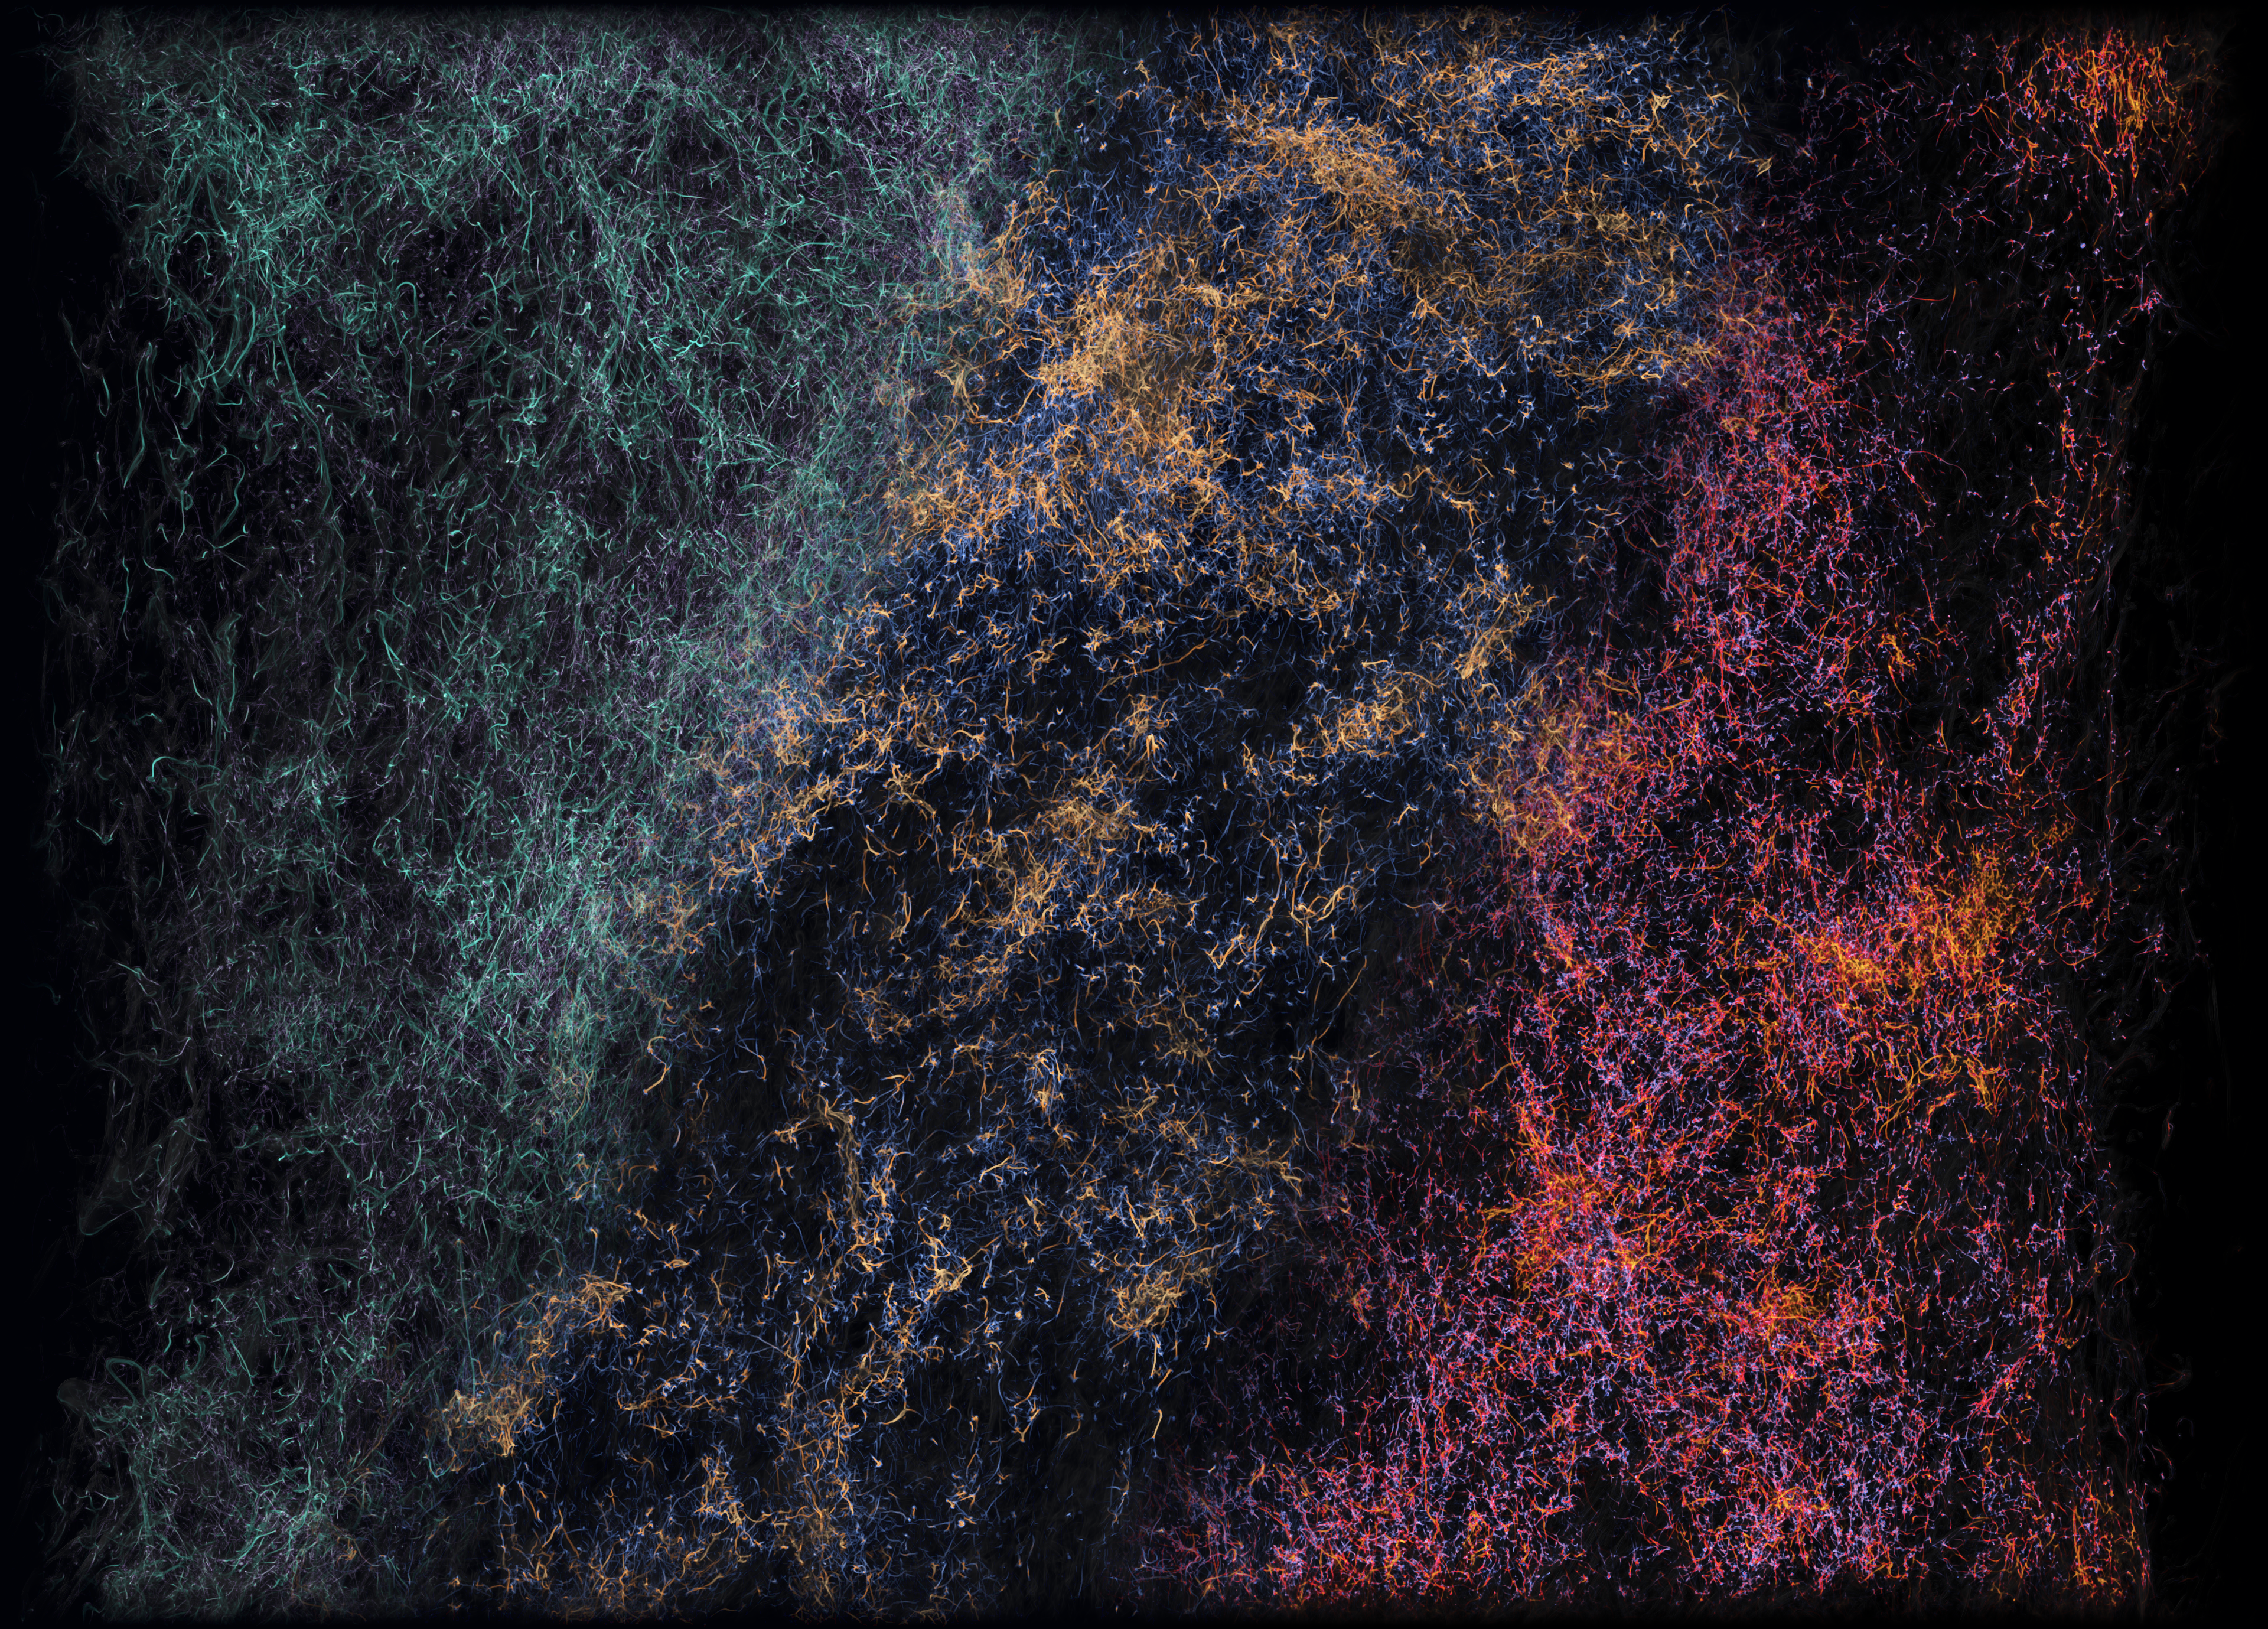
Three views of the same filaments at 2.49 eddy turnover times. From left to right,
the bands show gas temperature, magnetic field strength, and the local Ohmic heating rate.
Select the image for the full 3840 × 2758 render.
Cold filaments thread the hot atmospheres of galaxy clusters and glow in Hα.
Their emission can exceed what newly cooling gas would produce by recombining
just once, so something must keep replacing the energy they radiate. We ask
whether magnetized turbulence can deliver that heat to the cold gas.
Using three-dimensional Athena++ simulations with explicit resistivity and viscosity,
we follow magnetic and kinetic energy as they turn into heat. Radiative cooling
creates dense condensations, contraction can amplify their magnetic fields, and
turbulent motions produce current sheets and velocity strain. Both Ohmic and
viscous dissipation become concentrated in this cold, filamentary network.
About two thirds of the explicitly dissipated power goes into gas at
8,000–30,000 K. In the fiducial run, viscous dissipation supplies about
73% of the heating in this temperature range, with equal viscosity and
magnetic diffusivity.
The combined heating becomes comparable to radiative cooling near
104 K, helping sustain gas at filament temperatures while a separate
heating term maintains the hot phase. This provides a possible energy source for
the excess Hα emission; predicting the line luminosity itself will require
ionization and excitation modeling.
Dissipative Heating of Hα Filaments in Magnetized Turbulence
Three-dimensional MHD simulations, up to an effective 20483 grid.
Manuscript completed; arXiv link forthcoming.
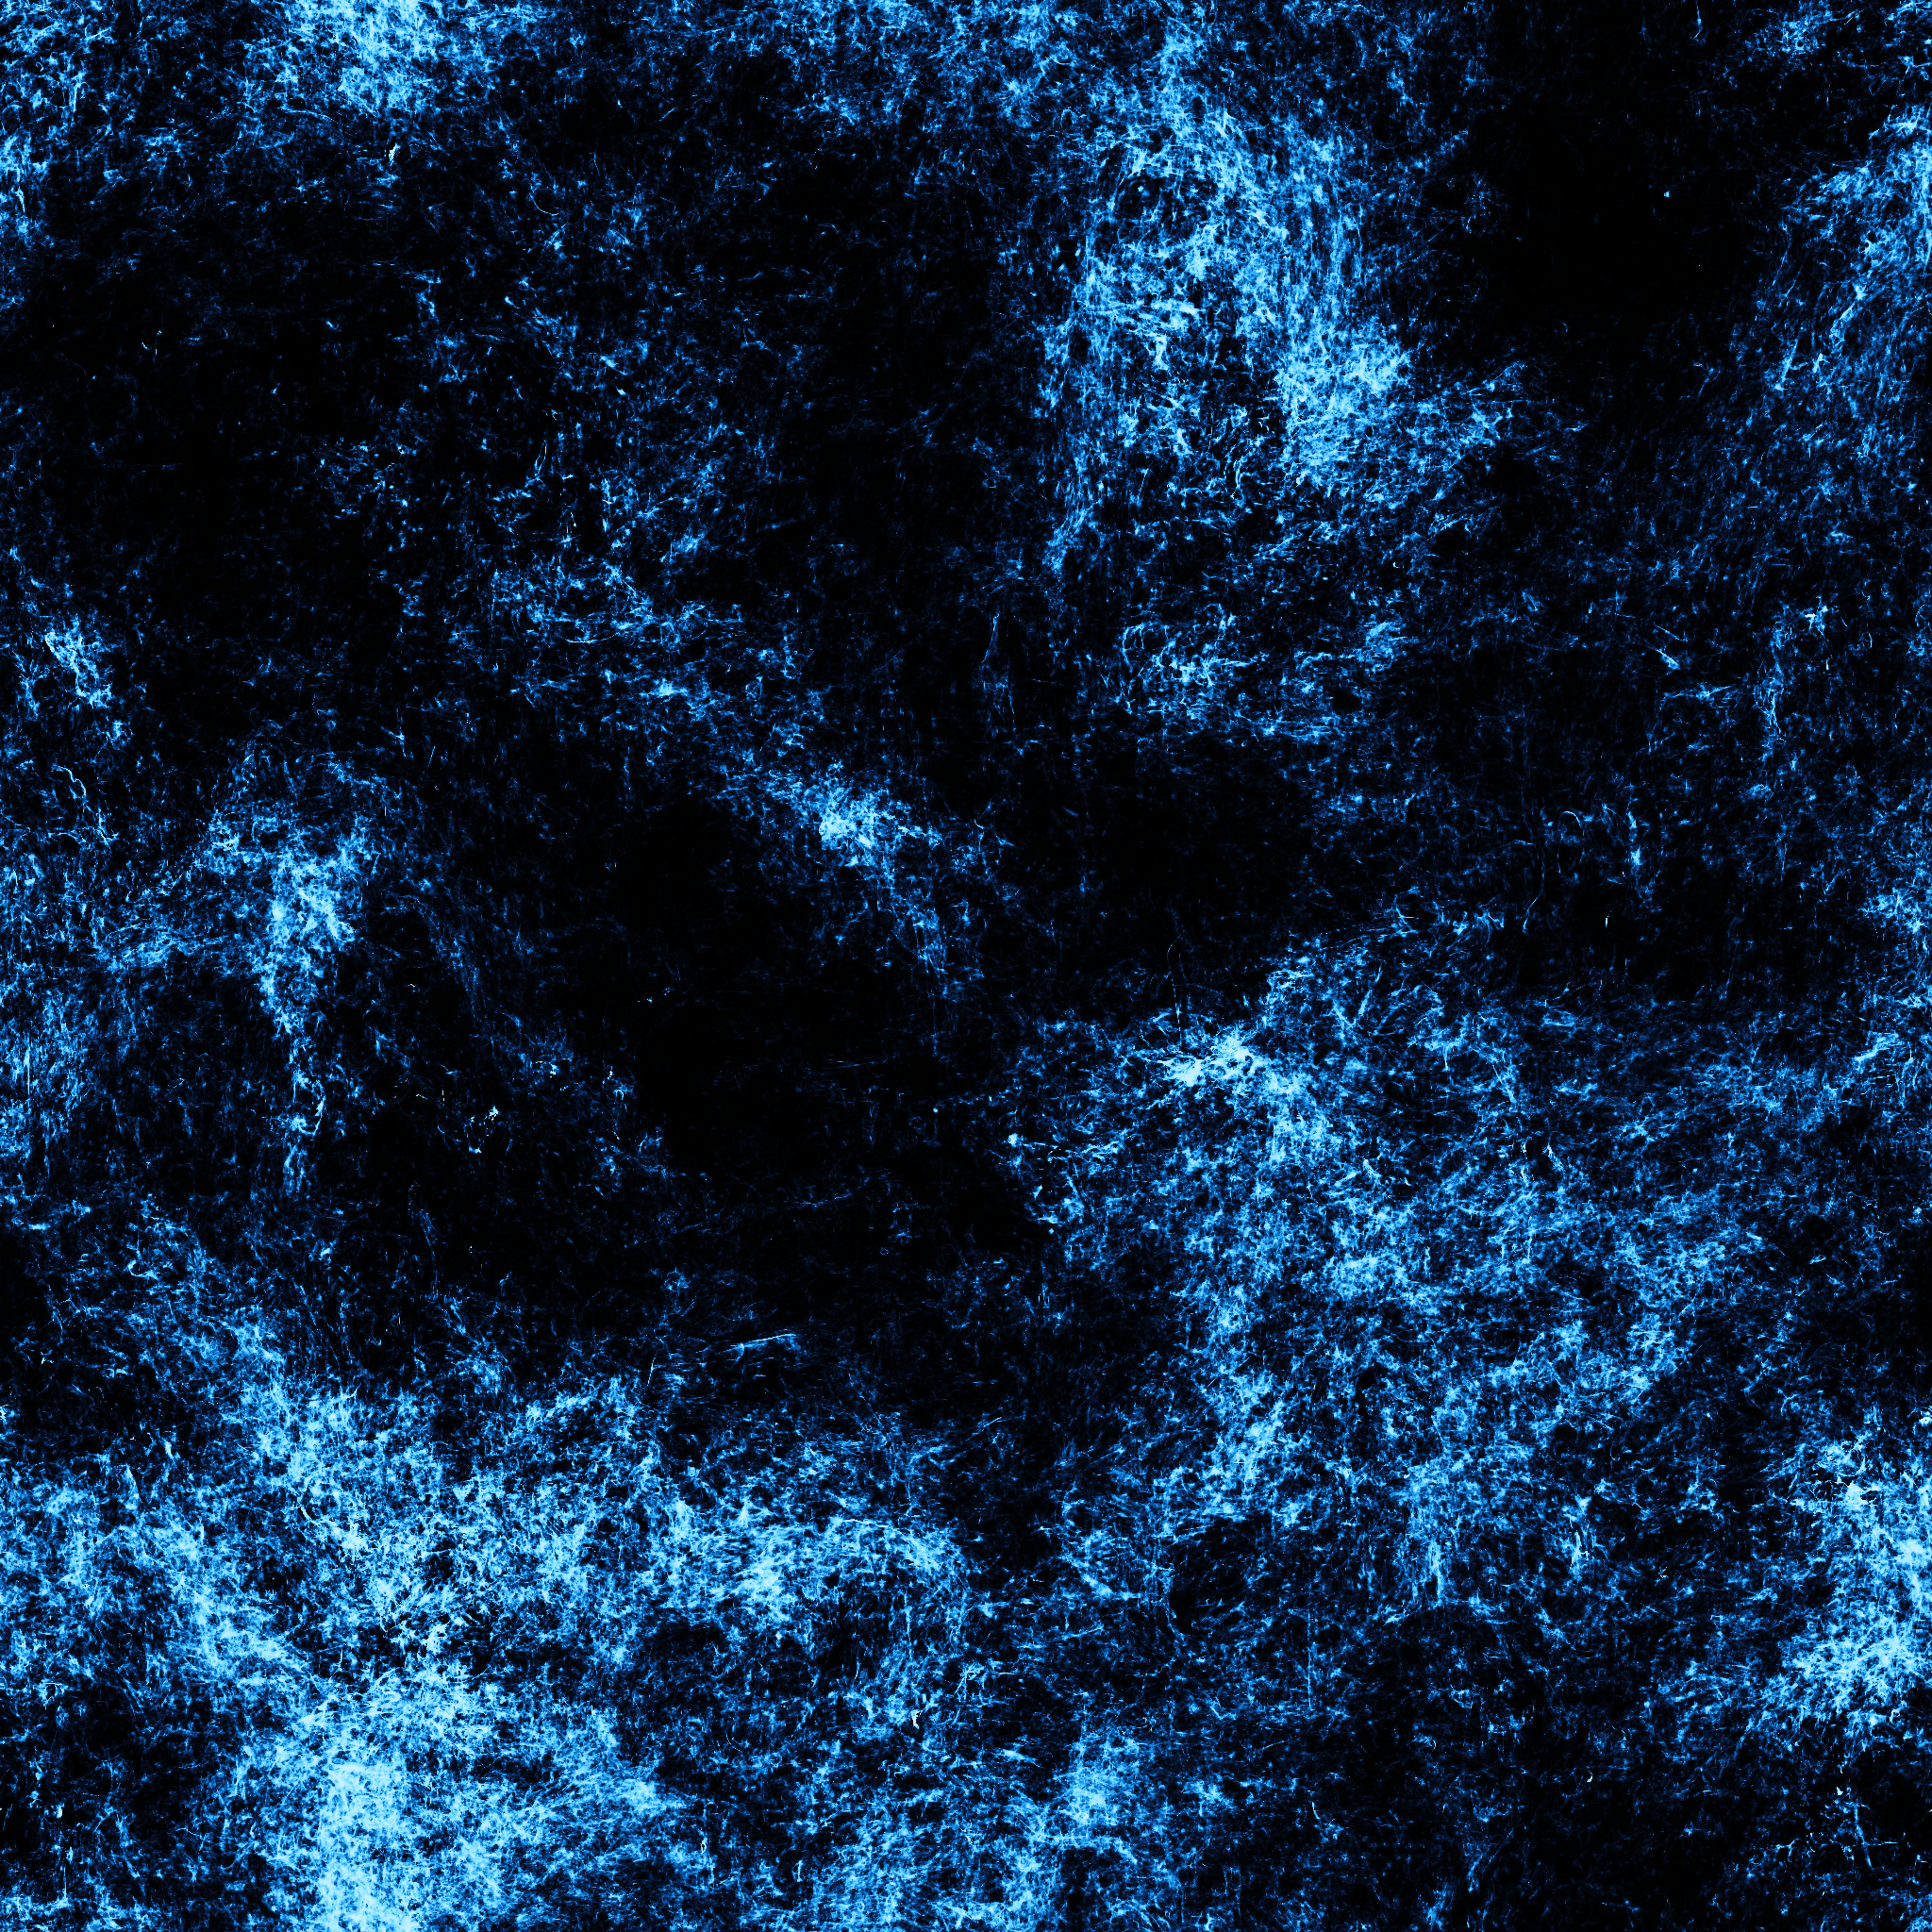
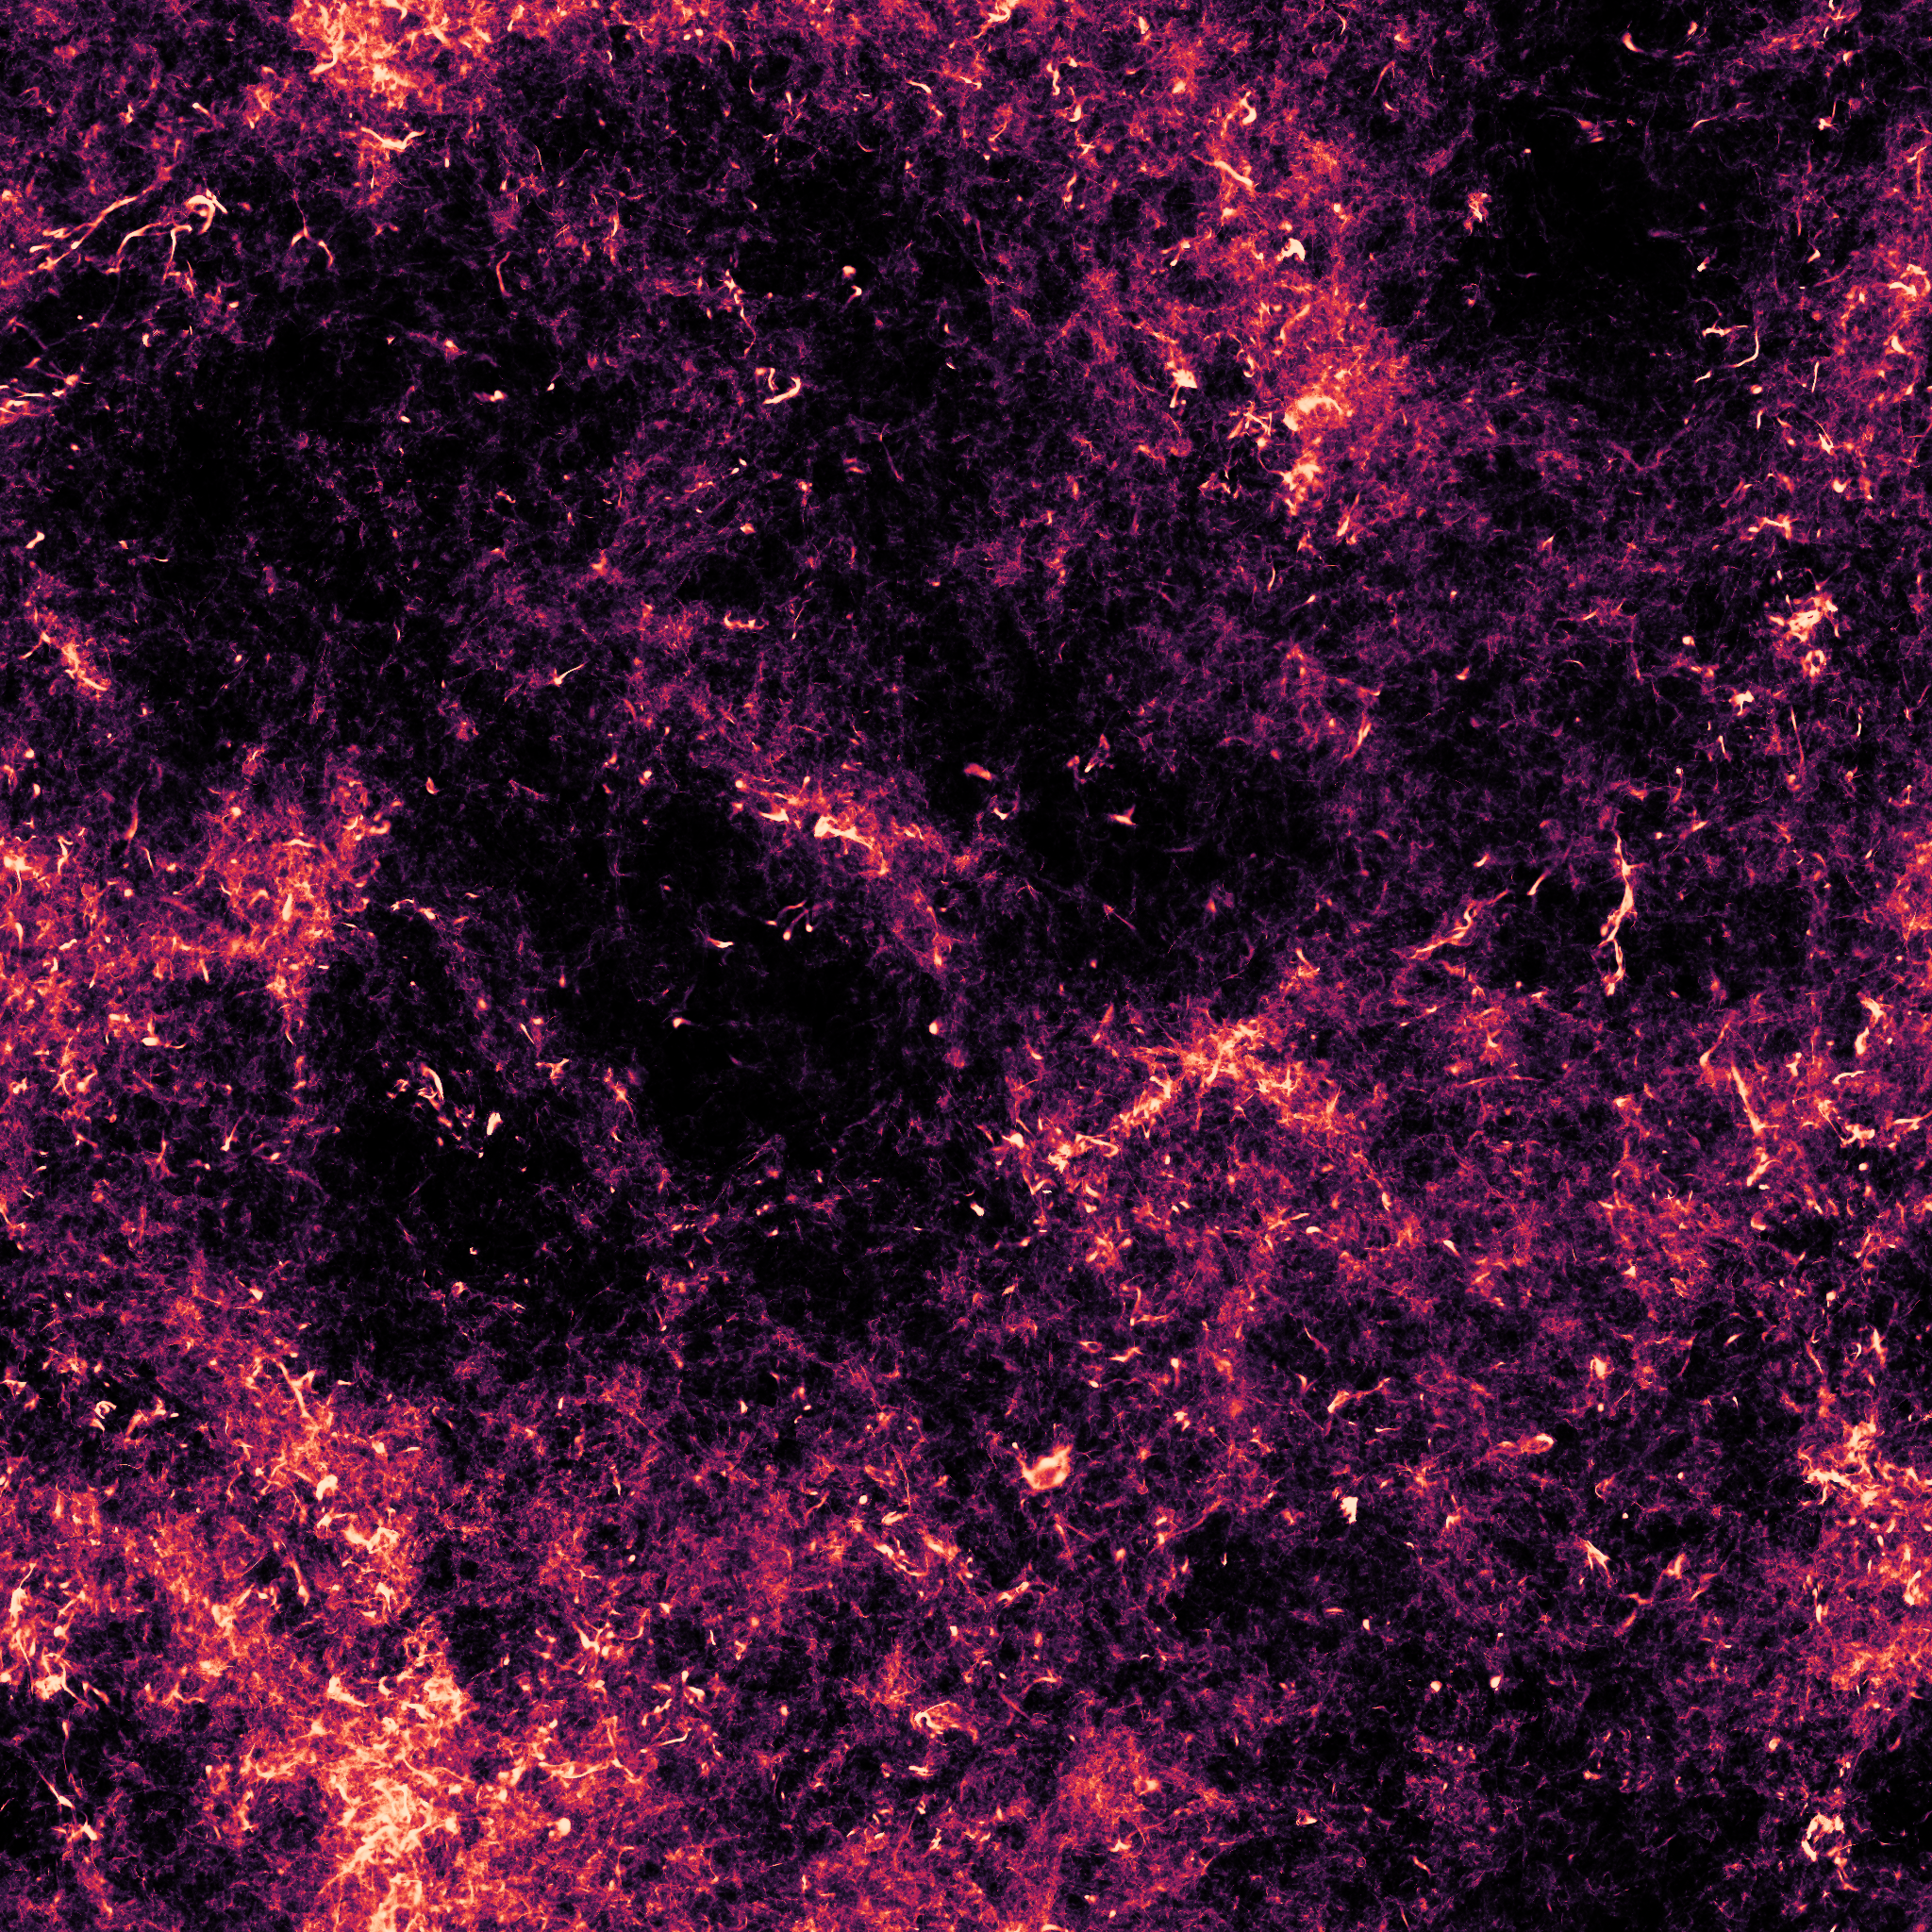
Move the slider to see where Hα emission (6563 Å) and soft X-rays
(0.5–2 keV) trace the same filaments across this 8 kpc field.
Drag or scroll to pan after zooming
All soft X-rayAll Hα
HαSoft X-ray
How to read the maps
Each pixel spans 3.91 pc and shows the emission integrated along the same line of
sight through the simulated gas. Brighter regions have higher surface brightness
within each band. Each map has its own contrast scale, so the colors let you
compare filament shapes and positions across the two bands.
A 24-second view of the native 10243 simulation in an
8 × 8 × 8 kpc box. The first 12 seconds follow temperature evolution
from a fixed viewpoint; the final 12 seconds orbit the last saved state,
moving through temperature, plasma β, intrinsic Hα emissivity and density.
Transitions blend rendered images of saved states; opacity is illustrative.
Use the full-screen control to see the fine structure.
Turn the volume, reveal its interior, and switch between density, temperature,
plasma β, Hα emissivity, Ohmic heating and viscous heating. The two heating fields
share a color scale so their structures can be compared directly.
Drag to orbit, scroll to zoom, or focus the volume and use the arrow keys and + / −.
The viewer opens with plasma β, the ratio of gas pressure to magnetic pressure.
Use Rotate to start or pause the turntable.